Persaud Lab
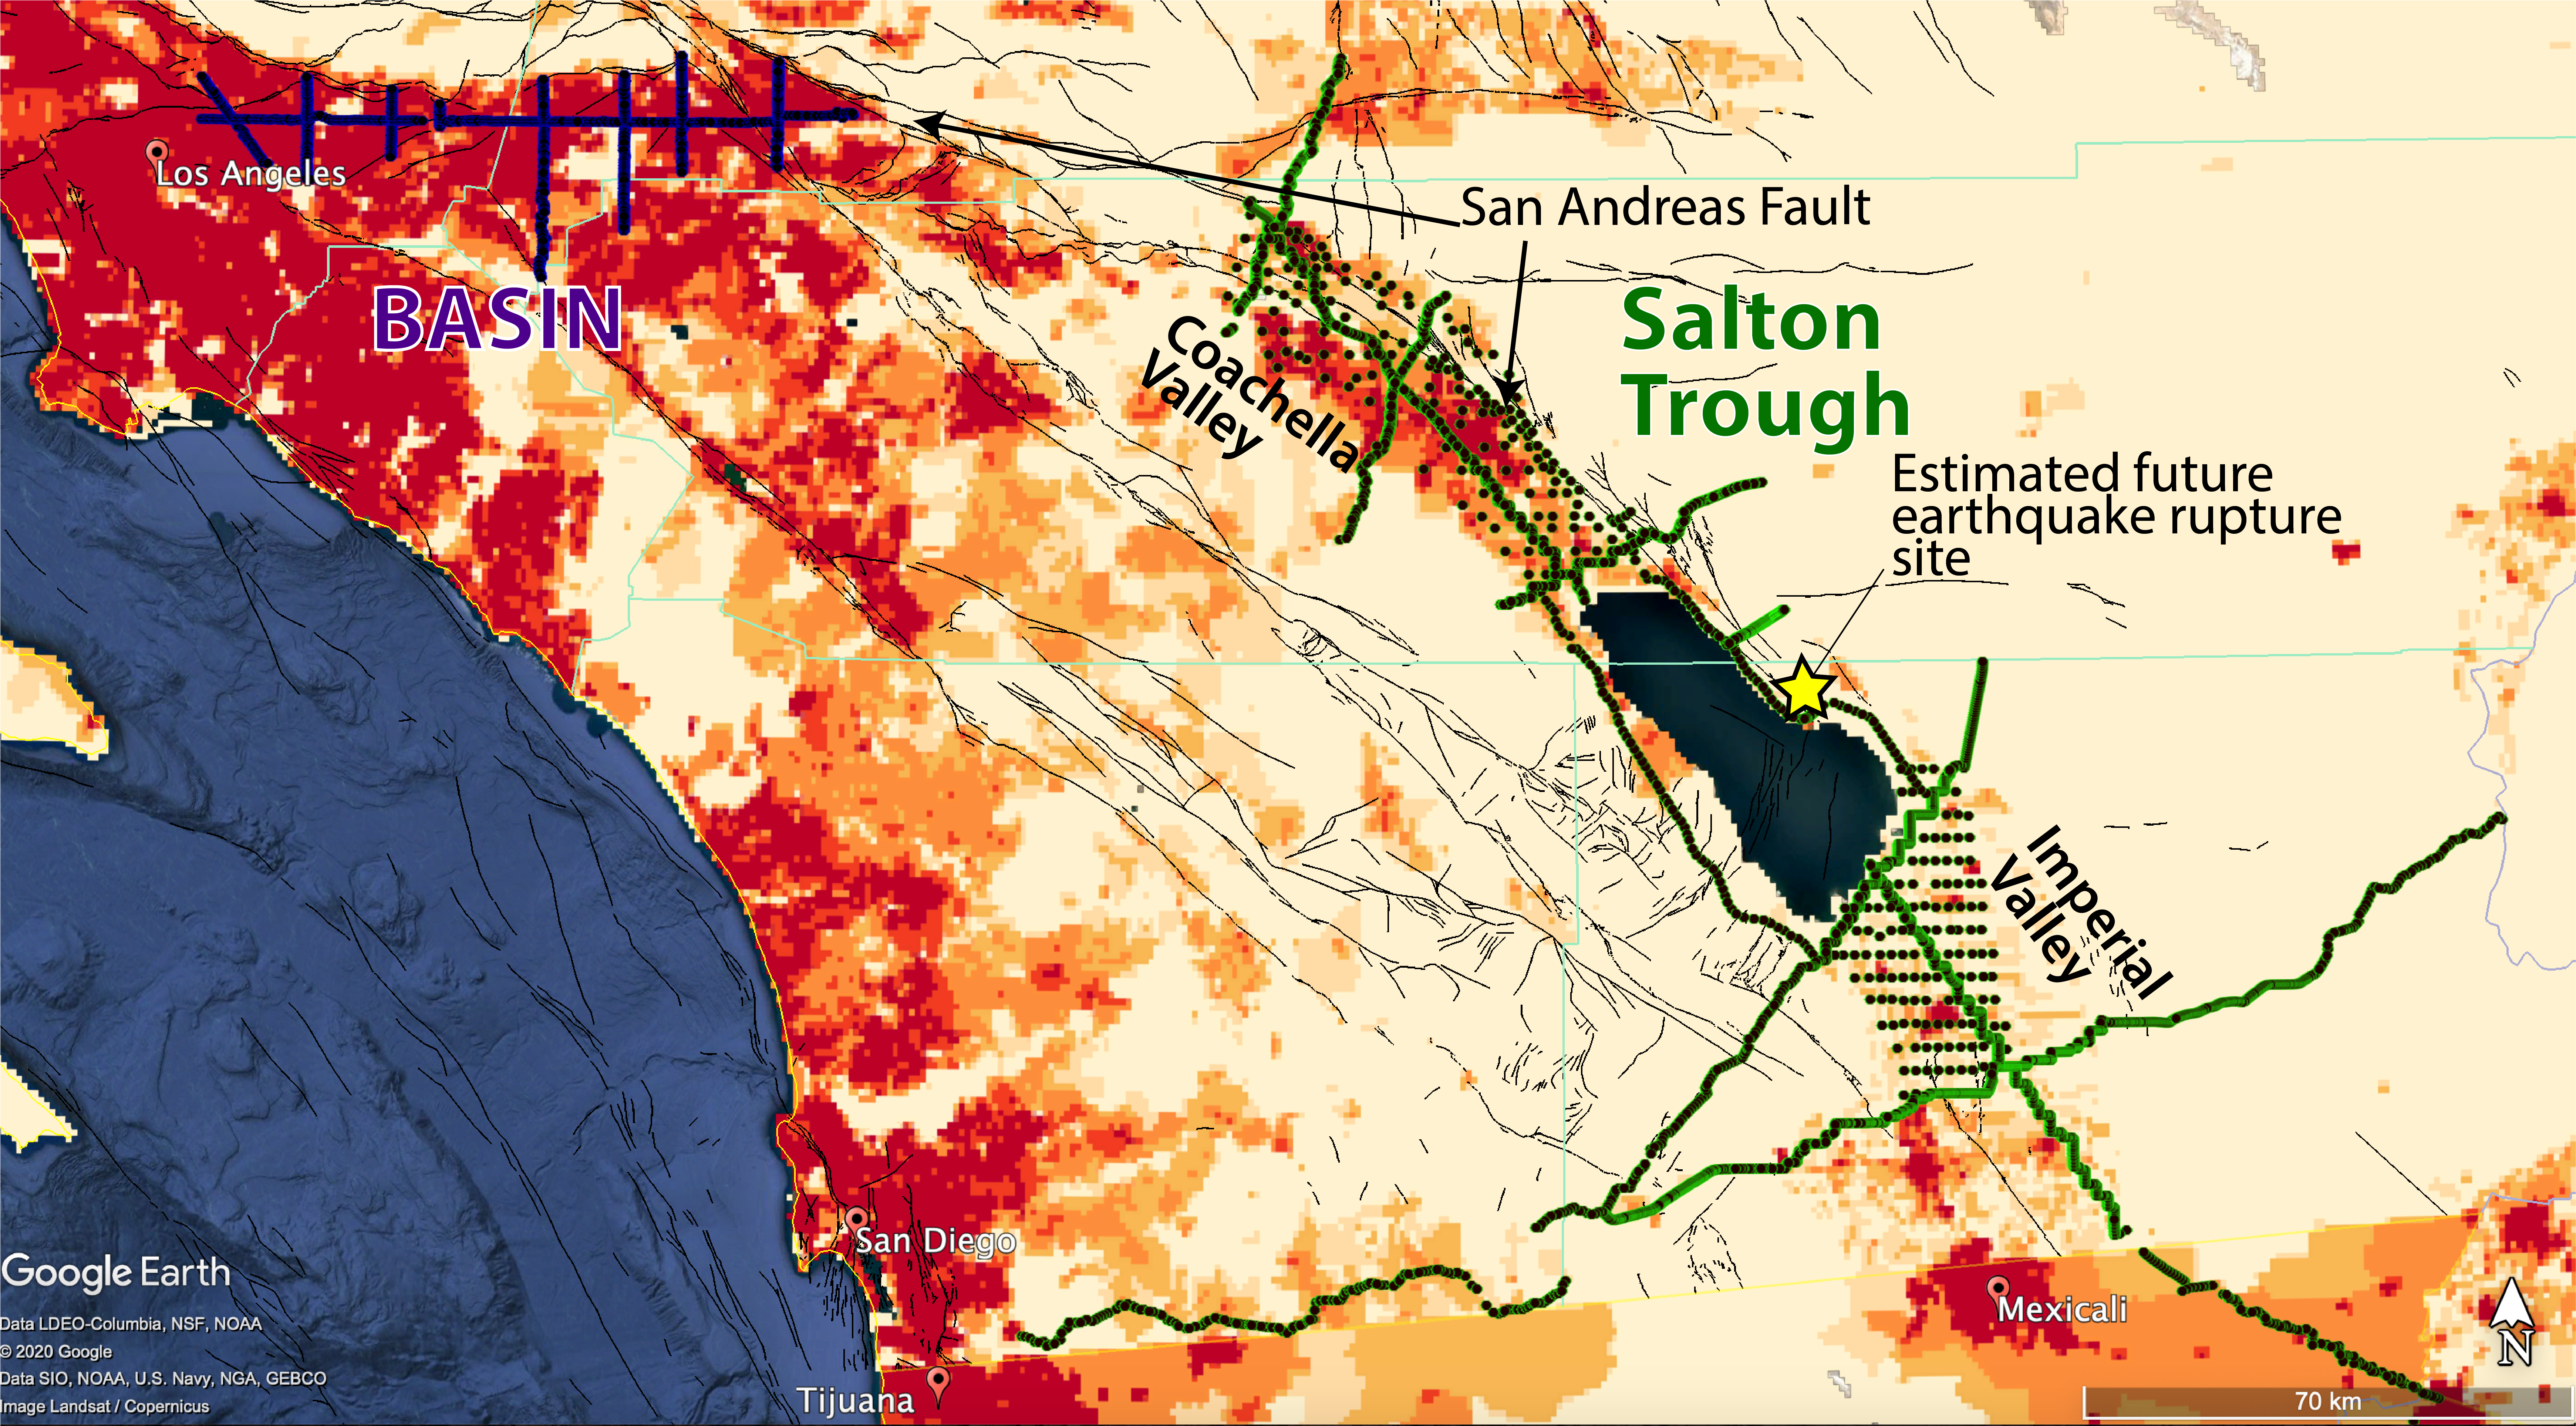
Population density map of Southern California (reds are higher population densities) showing the Salton Seismic Imaging Project receiver locations (green dots). The location of the passive source BASIN survey is also shown for reference. Black lines are faults.
- Determine hi-res 3-D travel time tomographic models for Imperial and Coachella Valleys (Persaud et al., 2016; Ajala et al., 2019).
- Develop hybrid Earth Models for earthquake ground motion estimation (Ajala et al., 2020).
- Estimate fault geometry from steep reflections.
Please cite Ajala et al. (2019) and Persaud et al. (2016) if you use the videos.
Above are preliminary wave propagation simulations of a Mw5.2 earthquake (black star) in four hybrid earth models in the Salton Trough, Southern California, showing vertical component of ground velocities. Red colors represent positive amplitudes and blue colors negative amplitudes. The top right and bottom left texts in the frames are simulation times and model labels, respectively. The composite model labels are based on the individual models that were included as follows: cv – Ajala et al. (2019) travel time velocity model; iv – Persaud et al. (2016) travel time velocity model; cvmh – Tape et al. (2009, 2010) F3DT model (CVMH-15.1); cvms5 – Lee et al. (2014) F3DT model (CVM-S4.26). All hybrid models include ely, a geotechnical layer from Ely et al. (2010). cvmh and cvms5 are regional community models used for hazard assessments in Southern California. Pink polygons show the areal extent of the models we developed in Coachella (cv) and Imperial (iv) valleys with good Salton Seismic Imaging Project (SSIP) data coverage. The red polygon in Imperial Valley shows the interpolated area of iv model used in constructing the hybrid model for the simulation, which does not always have well-determined model parameters outside the inner pink polygon area. The wavefield artifacts at the boundaries of red polygon for the cv + iv + cvmh simulation are a result of significant model contrasts between interpolated iv and cvmh. This highlights the need for refining the model boundaries to smoothly blend the different models when constructing the hybrid models.
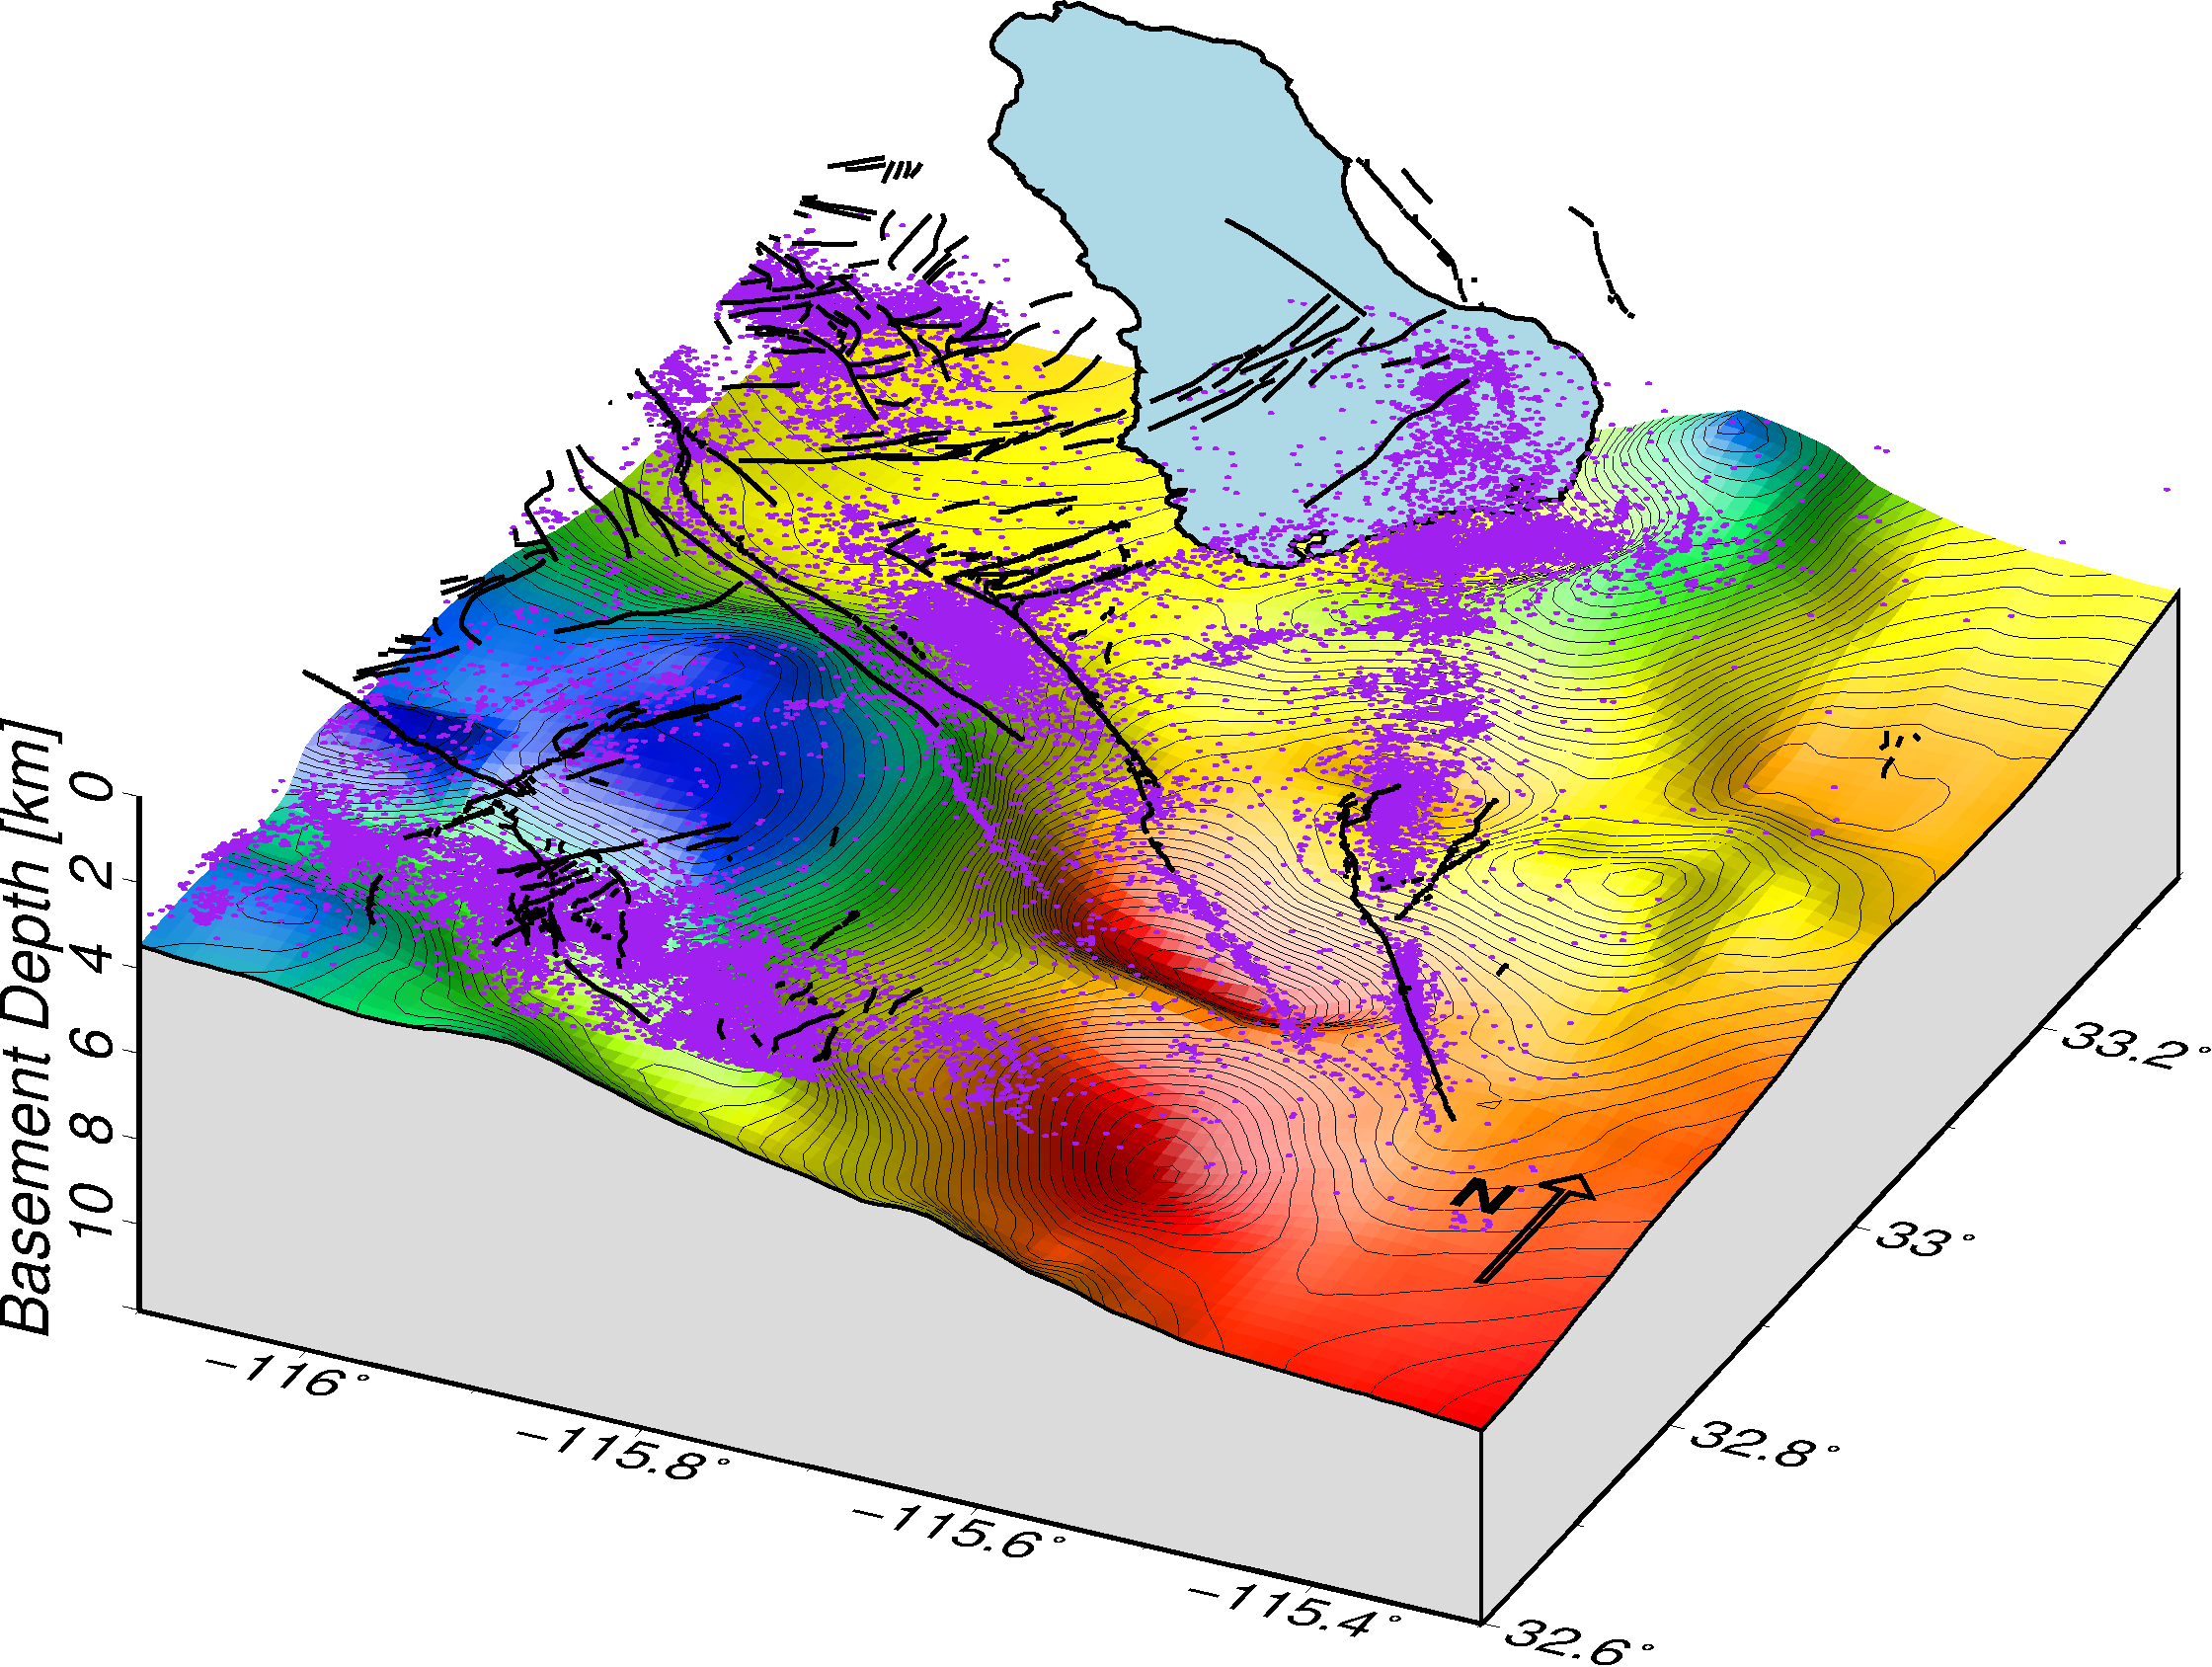
The Imperial Valley at the southern end of the San Andreas Fault system in the Salton Trough has deformation distributed across a complex network of exposed and buried faults. This has resulted in a largely unmapped seismic hazard beneath the growing population centers of El Centro, Calexico and Mexicali. To better understand the shallow crustal structure in this region and the connectivity of faults and seismicity lineaments, we used data primarily from the Salton Seismic Imaging Project (SSIP) to construct a P-wave velocity profile to 15 km depth, and a 3-D velocity model down to 8 km depth including the Brawley Geothermal area.
We obtained detailed images of a complex wedge-shaped basin, in which seismicity trends and active faults play a significant role in shaping the basin edge. Our model reveals previously unrecognized NE-striking cross faults that are interacting with the dominant NW-striking faults to control deformation. Our 3-D Vp model and basement map reveal velocity highs associated with the geothermal areas in the eastern valley. The improved seismic velocity model from this study, and the identification of important unmapped faults or buried interfaces will help refine the seismic hazard for parts of Imperial County, California. For more details see Persaud et al. (2016). To download the P-wave velocity model along SSIP-Line 2, click here.
ACKNOWLEDGMENTS
This research was supported by Southern California Earthquake Center awards 18074 and 19014. SCEC is funded by NSF Cooperative Agreement EAR-1033462 & USGS Cooperative Agreement G12AC20038. Portions of this research were conducted with high performance computing resources provided by Louisiana State University (http://www.hpc.lsu.edu).